Acne vulgaris
- Age-sex splitting
- Comorbidity correction (COMO)
- Meta-analysis of % mild/mod/sev Acne
- Severity splits
- Dismod-MR 2.1
Acute Endocarditis

- Age sex splitting
- CSMR from CODEm
- Claims data code adjustment
- Comorbidity correction (COMO)
- DisMod-MR 2.1
- Meta-analysis of moderate, severe
- Severity splits
Acute glomerulonephritis
- Age-sex splitting
- Comorbidity correction (COMO)
- Computing excess mortality from available incidence & CSMR data
- Crosswalk to US claims data 2012
- Dismod-MR 2.1
Acute Hep A
- Catalytic binomial model
- Comorbidity correction (COMO)
- Severity splits
Acute Hep B
- Carrier to acute conversion
- Comorbidity correction (COMO)
- DisMod-MR 2.1
- Severity splits
Acute Hep C
Acute Hep E
Acute Myocarditis

- Claims data code adjustment
- Disability weights for each sequela
- Comorbidity correction (COMO)
- DisMod-MR 2.1
Acute Urolithiasis
- Age-sex splitting
- Comorbidity correction (COMO)
- Computing excess mortality from available incidence & CSMR data
- Crosswalk to US 2012 claims data
- Dismod-MR 2.1
- Centrally applied severity splits
Alcohol dependence

- Age-sex splitting
- Comorbidity correction (COMO)
- Computing excess mortality from available incidence & CSMR data
- Conversion of "past year" prevalence data points into "point" prevalence data points
- DisMod-MR 2.1
- Severity splits
- Meta-analysis of % asymptomatic, very mild, mild, moderate, severe alchol dependence
Alopecia areata
- Age-sex splitting
- Comorbidity correction (COMO)
- Dismod-MR 2.1
- Meta-analysis of % mild and severe Alopecia Areata
- Severity splits
Alzheimer disease and other dementias
- Age-sex splitting and Age splitting
- CODEm
- Comorbidity correction (COMO)
- Dismod-MR 2.1 (model 1)
- Dismod-MR 2.1 (model 2)
- EMR regression using countries with highest CSMR to prevalence ratios
- Select countries with the highest CSMR/ prevalence ratios
- Garbage code redistribution
- ICD mapping
- Meta-analysis of % mild, moderate, severe Dementia
- Noise reduction
- Severity splits
- Age-sex spliting
- Standardize input data
Amphetamine use disorders

- Age-sex splitting
- Comorbidity correction (COMO)
- Computing excess mortality from available incidence & CSMR data
- Dismod-MR 2.1
- Mapping of EQ5D to SF-12
- Mapping to SF-12 GBD disability weight
Analytical flowchart for the estimation of cause-specific YLDs by location, age, sex, and year for GBD 2015
- 2. Data Adjustment
- Add study-level covariates
- Adjustment for multiple admissions in same individual
- Adjustment for multiple outpatient visits per prevalent/incident case based on claims data
- Adjustment for underreporting
- Adjustment from primary code to all code based on claims data for causes with long duration
- Age-sex splitting
- Compute excess mortality prior from available incidence or prevalence & CSMR
- Pre DisMod bias correction
- 3a. DisMod-MR 2.1 Estimation
- 3b. Alternative Disease Modeling Strategies
- Cancer
- Case fatality proportion and cause of death rate models
- HIV/AIDS and TB
- Malaria
- Neonatal disorders
- Seroprevalence to incidence models
- 3c. Injury Modeling strategy
- Apply cause-nature of injury matrices
- Determine most severe nature of injury category in any individual
- DisMod-MR 2.1
- Estimate duration of short-term disability
- Generate cause-nature of injury matrices with neg. binomial models
- Meta-analysis
- Probability of long-term disability
- 4. Impairment and Underlying Cause Estimation
- Apply etiology/severity proportions to disease/impairment morbidity estimates
- Scale impairment prevalence by underlying cause or severity to envelope
- Scale to 100%
- 5. Severity Distribution
- DisMod analysis proportion by severity level
- Map EQ5D to SF-12
- Map SF-12 to GBD disability weights
- Meta-analysis proportion by severity level
- Regression to estimate disability weight by cause in survey resps controlling for comorbidity
- Scale to 100%
- 6. Disability Weights
- Analysis of paired comparison & population health equivalence responses
- 7. Comorbidity
- 8. YLDs
- YLD to YLL ratio for 12 residual causes without primary data
Anemia

- Average Hemoglobin decrement ("shift") caused by each etiology
- Bayesian contingency table modeling of etiology and severity-specific prevalence
- Calculate 95%-ile of all country-years by age and sex = "Normal" hemoglobin
- Calculate counterfactual hemoglobin shift removing all causes except IDA
- Calculate difference between predicted and normal hemoglobin for each country-year-age-sex = TOTAL hemoglobin shift
- Cause-specific hemoglobin shift
- Comorbidity correction (COMO)
- Divide TOTAL anemia proportionally to each cause based on the proportion of total shift attributable to that cause
- Use WHO thresholds, mean hemoglobin, and distributions to estimate prevalence (area-under-curve)
- Split data into two groups
- MoM of distribution fits for all single distributions
- Calculate Prediction Errors of mild, moderate, severe anemia, weighting by Disability Weights
- Method of Moments
- DisMod-MR 2.1
Anorexia nervosa
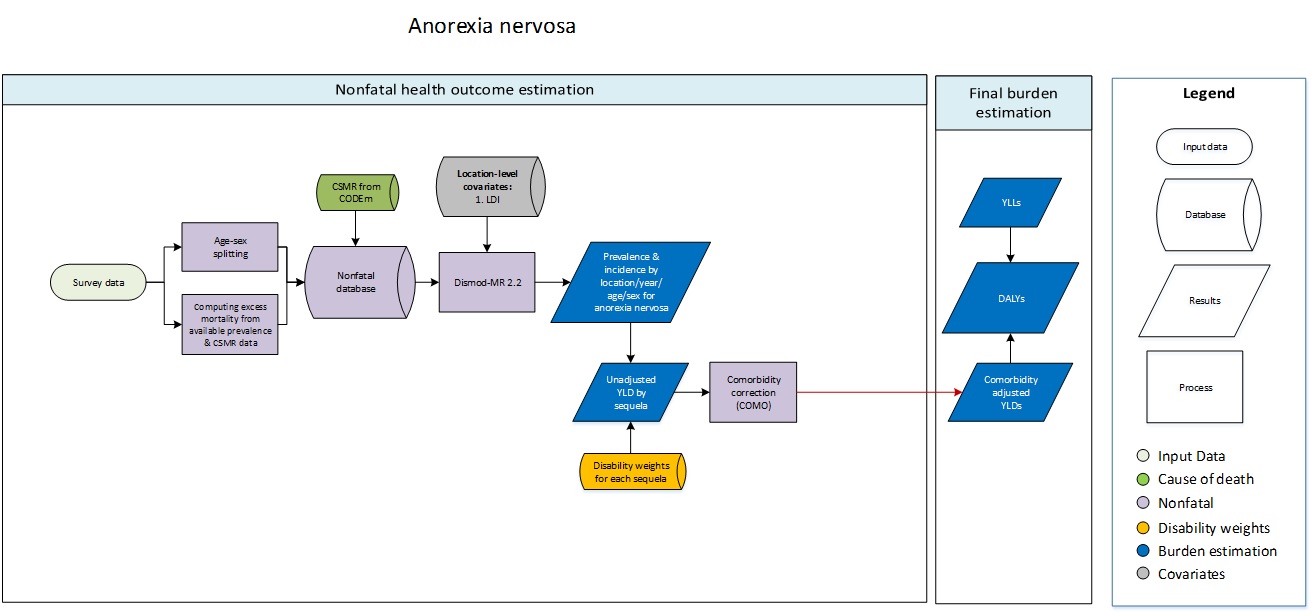
- Age-sex splitting
- Computing excess mortality from available prevalence & CSMR data
- Comorbidity correction (COMO)
- Dismod-MR 2.1