Analytical flowchart of the comparative risk assessment for the estimation of population attributable fractions

- 1. Effect size estimation
- 1b. Adjustment of relative risk to be compatible with exposure
- 1b. Integrated exposure response curve
- 1b. Meta-analysis\meta-regression of relative risks
- 1b. Select best unbiased study
- 2. Exposure estimation
- 2b. Age-sex split
- 2b. Correct for representativeness
- 2b. Cross-walk between different definitions
- 2b. Cross-walk between measurement methods
- 2c. Bayesian cross-walk using satellite models
- 2c. Cohort-based simulation
- 2c. DisMod - MR 2.1
- 2c. Out sample cross validation
- 2c. ST-GPR
- 2d. Assess distribution in population
- 3. Estimate summary exposure values
- 4. Theoretical minimum risk exposure level
- 4b. Calculate\decide TMREL and uncertainty
- 5.Estimate population attributable fractions
- 6. Mediation
- 7. Estimate attributable burden
Alcohol Use

- Adjust for tourism
- Calculate PAFs
- Crosswalk using mixed effect model
- Dismod-MR 2.1
- Meta-analysis of relative risks
- Adjust for unrecorded consumption, scale proportions, and split by age/sex proportions
- ST-GPR
- Adjust MVA PAF
- TMREL
Ambient Ozone

- Application of mediation factors
- Calculate PAFs
- Calculate relative risk
- Calculate TMREL
- Multi-model fusion
Ambient Particulate Matter
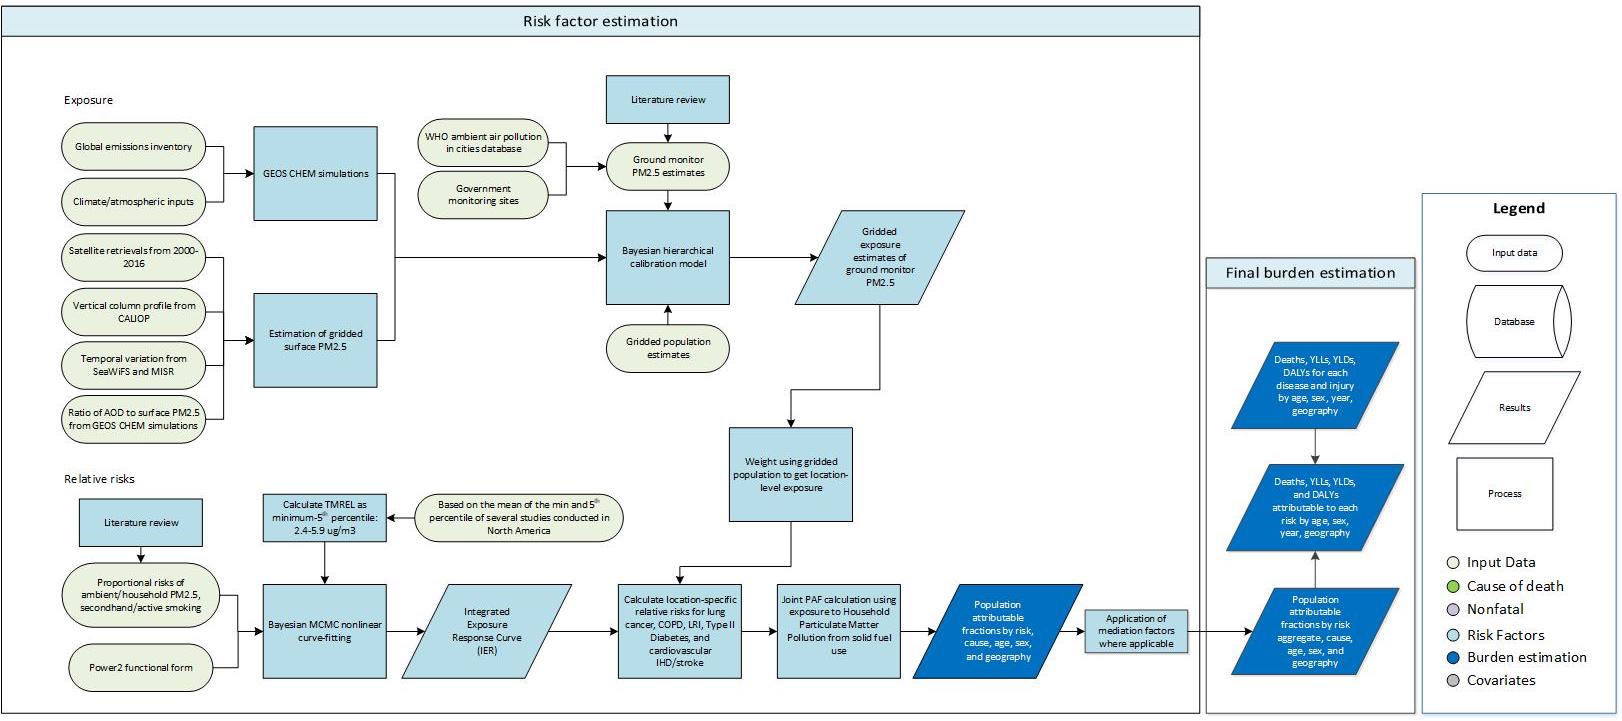
- GEOS CHEM simulations
- Estimation of gridded surface PM2.5
- Bayesian Hierarchical Calibration model
- Weights using gridded population
- Bayesian MCMC nonlinear curve-fitting
- Calculate Relative Risks
- Joint PAF Calculation
- Literature review
- Relative risks literature review
- Application of mediation factors where applicable
Body Mass Index

- Age-sex splitting
- Self-report adjustment
- ST-GPR model specification
- ST-GPR computation
- Estimating mean BMI
- Characterizing the BMI distribution
- Calculate PAFs
Bone Mineral Density

- Age specific 99th percentile as TMREL
- Calculate PAFS
- Dismod-MR 2.1
- Calculate ensemble weight distribution
Bullying victimization

- Exposure
- Relative risks
- PAFs
Chewing tobacco

Child growth failure

- Mean, SD of height-for-age (HAZ), weight-for-age (WAZ), weight-for-height (WHZ) z-scores
- Calculate height-for-age (HAZ), weight-for-age (WAZ), weight-for-height (WHZ) z-score for children 0-59 months using WHO Child Growth Standards (2006)
- ST-GPR linear mixed effects model: Mean, Prevalence < -2, < -3
- Optimize SD on Mean, Prevalence of < -2, < -3
- Ensemble distributions fit using individual level microdata by survey and sex
- Combine distribution weights with mean, SD to create z-score distribution
- Integrate at -1 SD, -2 SD, and -3 SD thresholds (mild, moderate, and severe)
- Calculate the effect of each of the three undernutrition indicators adjusted for the effect of the other two
- Calculate PAFs using exposure, relative risks, and TMREL
Childhood Sexual Abuse

- Calculate PAFs
- Dismod-MR 2.1
- Pooled cohort analysis\custom meta-analysis
Dietary Risks

- Estimating Missing Country-Years of FAO & Sales Data (ST-GPR)
- Global Age Pattern of Consumption (DisMod)
- Age Splitting of FAO & Sales Data
- Adjustment to Optimal Assessment Method (Mixed Effects Regression)
- TMREL
- SBP-CVD RR by age
- Estimating missing country year data (ST-GPR)
- Ensemble Distribution Fitting
- Estimating Mean-SD relationship
- Age pattern estimation based on metabolic indicators
- PAF Calculation
Drug Use

High fasting plasma glucose

- Directly calculated population attributable fractions
- Risk factor estimation
High systolic blood pressure

- Age-sex splitting
- Calculate PAFs
- BRFSS crosswalk
- Standard deviation model
- Covariate selection process
- Usual blood pressure adjustment
- ST-GPR
- RR
- TMREL